InStat Research Portfolio

InStat Research developed out of a realization that quantifiable technical analysis is one of the best measures for evaluating price movement of financial instruments. Lead by Anthony Abry, a Chartered Market Technician (CMT), InStat Research uses Amibroker technical analysis software for a majority of its development. Below, find a sample of strategies using Amibroker, Excel, and Interactive Broker's Trader Workstation (TWS).
M&M Strategy

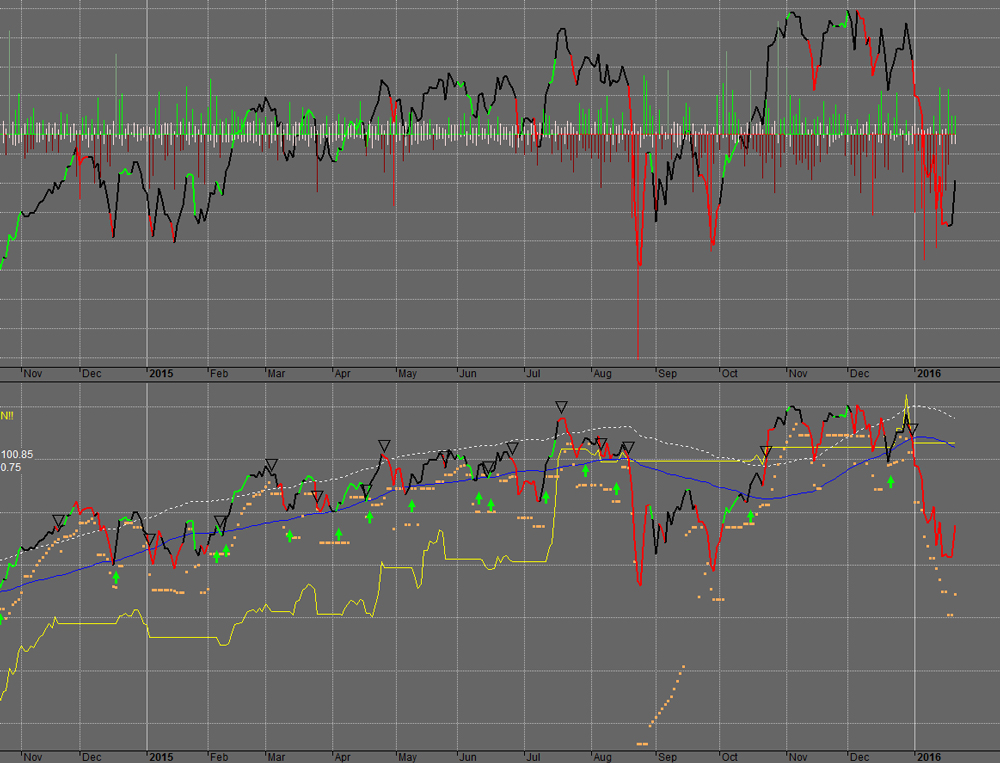
This strategy trades in the direction of the breadth of the market. The market is defined as all the companies in the Russel 3000 index. All companies of the Russel 3000 are scanned daily for if they have moved up or down by more than 4%. A moving average of the ratio of Up / Down is created. If the moving average is increasing, we have a positive momentum. This signal is only used during upwards trending markets as measured by an occasionally optimized moving average.

The result is a cautiously traded strategy which is complementary to other strategies. The win loss ratio in the last few years has been high and the holding period is 7 - 8 days. I tends to not trade in periods of market decline. Hence its system drawdown is low at -8% vs a -56% for the SP500 for a Buy and Hold approach.


Instat T_System2 screenshot


Instat T_System2 screenshot

OR_RTM Strategy

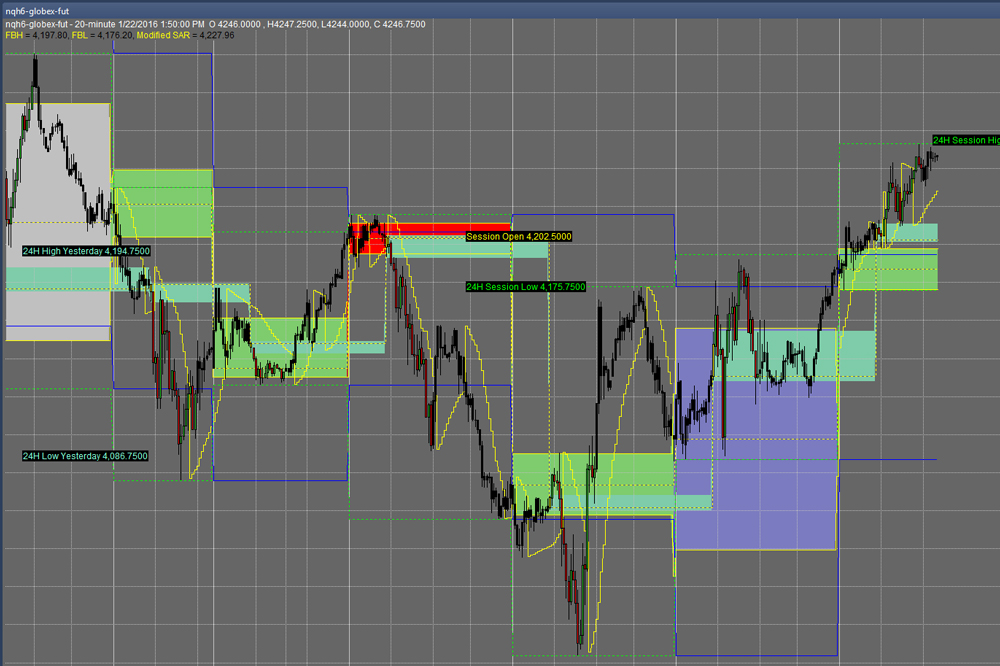
This intraday strategy trades the 24 hour futures market and is a combination of 2 strategies, a trend following and a reversion to the mean strategy. The original concept was developed by Toby Crabel. The basic principle in this strategy is that markets expand and contract on a regular basis. The reversion to the mean strategy is automatically selected to trade after a large trend following day. The trend following day is defined as a largest range in price movement for the last 4 or 7 days (WR4, WR7). After such a movement, the market tends to contract for a short period of time and can be traded with a reversion to the mean strategy. Upper and Lower boundaries are defined with the market's movement in recent history (ATR). After a market contracts, it is ready to expand again. On such expansion days, the strategy switched to a trend following mode. The direction of the trend is anticipated with an Opening Range Breakout system and follows the trend until stopped out with a parabolic stop, or a reversal of direction.

ScareCrow Trading

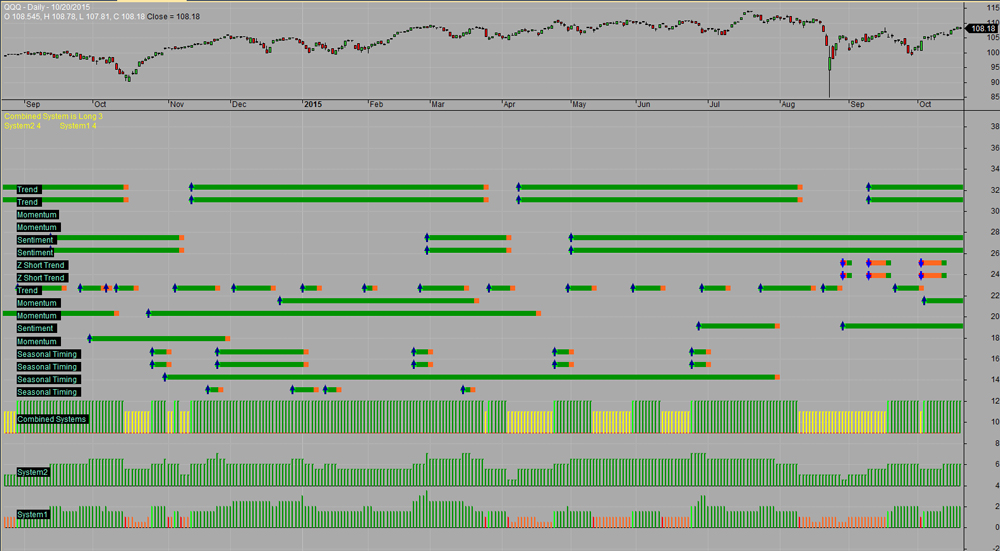
This is an end of day system by ScareCrow Trading. It combines 17 systems which include trending, momentum, short term trend, and seasonal systems into two aggregate systems which then are combined into one signal generating system. Depicted are the various individual systems as well as the subsystems and the final system. On the combined systems green means long, yellow is flat and orange is short.

The outputs include all the strategy statistics, day by day signals for all systems, as well as error checking for data holes.


Instat T_System2 screenshot


Instat T_System2 screenshot

Automated Pivot Trading

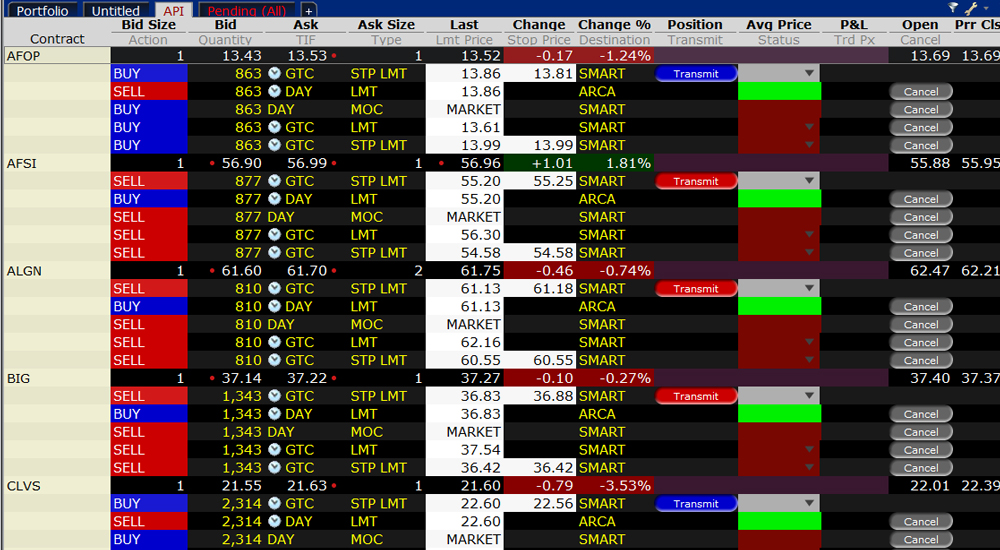
This strategy scans a portfolio of stocks every 30 seconds during volatile markets. When it finds a price which is close to a desired trading point, it will place a multi-combination order to the broker where it will wait until its price gets hit (initial parent order is a limit order). The consideration in such a design were that a completely reactive model would be too slow to place orders because of internet, computer and data lag.